01 Mar 2024 All India Household Consumption Expenditure Survey Report 2022 – 23
Source – The Hindu and PIB
General Studies – Development of Indian Economy, Ministry of Statistics and Program Implementation, All India Household Consumption Expenditure Survey Report 2022 – 23
Why in the News ?
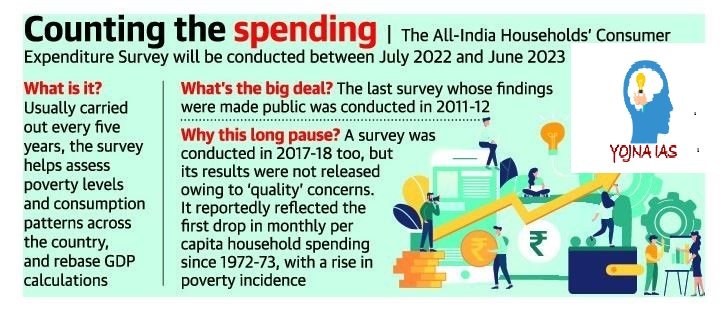
- Recently, the Ministry of Statistics and Program Implementation (MoSPI) has released the data of All India Household Consumption Expenditure Survey 2022-23 based on the results of the survey conducted between August 2022 and July 2023 on the Indian economy.
- All India Household Consumption Expenditure Survey (HCES) is a survey conducted every five years by NSSO to ascertain household spending habits. The Government of India had rejected the final survey results of 2017–18 citing ‘data quality issues’. After that, this survey method was modified. Now, MoSPI is working on back-to-back surveys for 2022-23 and 2023-24 to check the robustness of the revised methodology for consumption expenditure and consistency of the results.
All India Household Consumption Survey Report :
- Household Consumption Expenditure Survey (HCES) is conducted to assess household spending habits. It provides important insights into household consumption patterns, their living standards and overall well-being.
- This survey report released by the Government of India is a five-year survey, that is, it is released at an interval of every five years.
- It is conducted by the National Sample Survey Office (NSSO), which now comes under the National Statistics Office in MoSPI.
Historical significance of All India Household Consumption Survey report :
- In India, this survey report has been conducted every five years since 1972-73.
- The survey results were canceled in 2017–18 due to ‘data quality issues’.
- At present, the Government of India is conducting the survey according to the new method in the year 2022-23 and 2023-24.
New method of releasing All India Household Consumption Survey Report :
New method of releasing All India Household Consumption Survey report by National Sample Survey Office (NSSO) of Government of India In many new features have been added. Which is divided into the following categories –
- Dividing the consumption basket into three broad categories
- Food items, consumables and services and durable goods.
- Questions seeking information on free items and subsidies under welfare schemes such as food grains have been included.
Difference between per capita consumption at rural and urban level :
- The gap between rural and urban per capita consumption is narrowing, however, real rural per capita expenditure growth has declined. In both nominal and real terms, these growth rates are lower than in the period between the two previous surveys.
Conclusion of All India Household Consumption Survey Report :
Increase in Average Monthly Per Capita Consumption Expenditure (MPCE) :
- The increase in per capita expenditure in India indicates rising disposable income of households, reducing inequality between rural and urban areas and declining poverty levels.
- In the period from 2011-12 to 2022-23, rural per capita consumption expenditure has increased more rapidly than the expenditure of urban persons.
- Rural per capita consumption expenditure has increased by 164%. It has increased from Rs 1,430 in 2011-12 to Rs 3,773 in 2022-23. C. Urban per capita consumption expenditure has increased by 146%. It has increased from Rs 2,630 in the year 2011-12 to Rs 6,459 in 2022-23.
Decline in the share of expenditure on food at rural and urban level :
- The decline in the share of expenditure on food in India explains households’ spending on consumer durables, clothing and footwear and entertainment.
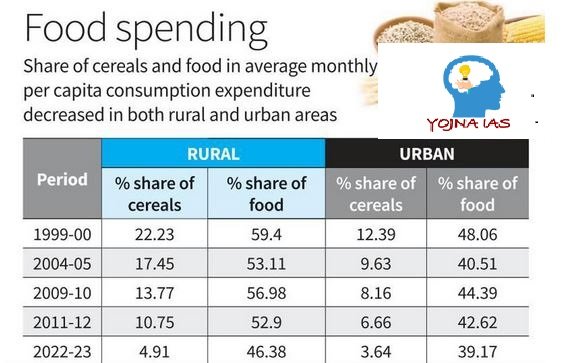
- According to this report – the share of expenditure on food per capita has gradually decreased at both urban and rural levels.
In rural India, the share of food in average monthly per capita consumption expenditure (MPCE) has declined from 59.46% in 1999-2000 to 46.38% in 2022-23. - In urban India, the share of food in average monthly per capita consumption expenditure (MPCE) has declined from 48.06% in 1999–2000 to 39.17% in 2022–23.
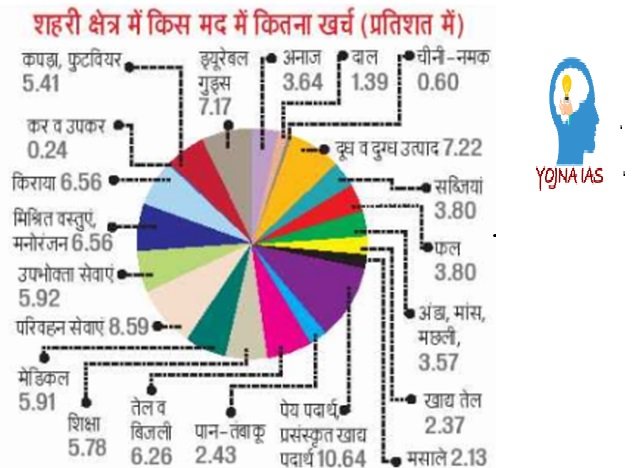
Share of expenditure on various food items in food expenditure :
- According to this survey report in India this data only helps in ascertaining the amount of money spent for cereals (rice, wheat), improved nutrition (eggs, fish, meat, fruits and vegetables).
- Over the past two decades, expenditure on high-value nutritional items (eggs, fish, meat, fruits and vegetables) has increased more among rural than urban households.
- Rural household expenditure on high value nutrition items to increase from 11.21% in 1999-2000 to 14% in 2022-23. Expenditure on cereals has declined from 22% in 1999-2000 to 4.91% in 2022-23C. Urban household expenditure on high-value nutrition items is expected to increase marginally from 10.68% in 1999-2000 to 11.7% in 2022-23. Expenditure on cereals has declined from 12% in 1999-2000 to 3.64% in 2022-23.
Average monthly consumption expenditure per capita :
- The All India Household Consumption Survey report data by the National Sample Survey Office (NSSO) of the Government of India helps in ascertaining the impact on expenditure by summing up the price free goods received by households through various social welfare programmes. This data helps in ascertaining the impact on expenditure among different income groups. Also helps in highlighting socio-economic inequalities.
- The estimated MPCE at both rural and urban levels is higher than the average MPCE which does not include free goods.
The estimated MPCE of the top 5% of the rural population is 7.65 times higher than that of the bottom 5%.
The estimated MPCE of the top 5% of the urban population is 10 times higher than its bottom 5%.
State wise consumption expenditure of different states of India :
- State wise consumption expenditure of different states of India By compiling the data state-wise consumption expenditure it presents a comparative study and presents a picture on the economic-well-being of households in a particular state.
- Sikkim has the highest MPCE for both rural (Rs 7,731) and urban households (Rs 12,105).
- Chhattisgarh has the lowest MPCE for rural (Rs 2,466) and urban households (Rs 4,483).
Importance of All India Household Consumption Survey Report :
Changing the weighting of components to accurately capture inflation :
- The Consumption Expenditure Survey serves as a benchmark for assigning and changing weights for various components of the Consumer Price Index (CPI). According to earlier survey data, the weightage for food in the CPI will have to be reduced.
Macro analysis of the economy :
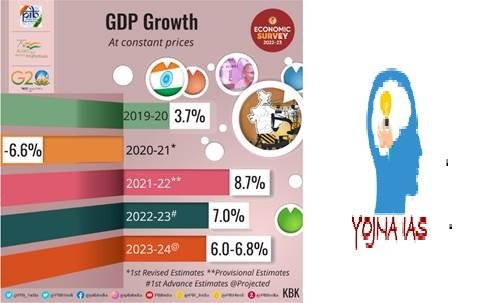
- Household consumption expenditure survey data is used by economists to analyze structural changes in the Indian economy and to measure measures such as GDP and poverty levels.
Assessment of economic development trends and inequalities :
- The Household Consumption Expenditure Survey indicates a narrowing gap in per capita expenditure between rural and urban India. However, it also highlights wide income gaps within households, with the top 5% of households spending significantly more than the bottom 5%.
Fine-tuning tools for policy makers :
- The imputed MPCE provides important insights to policy makers to fine-tune social schemes by understanding the changing consumer spending behavior.
Guidelines for State Governments :
- State governments can use the survey to rework their budgetary strategies to increase disposable income in the hands of people by learning from states like Tamil Nadu and Kerala.
Forecasting Tools for Industry :
- The survey report provides industries with information about changing consumer behavior, which helps them refine their strategies and enter emerging markets.
Challenges of All India Household Consumption Survey Report :
Strengths of the Modified method :
- The latest survey for 2022-23 has been conducted according to the revised methodology. The next set of Consumer Expenditure Survey for 2023-24 is required to confirm the robustness of the revised methodology.
Small data set :
- The survey covered 2.62 lakh households (1.55 lakh-rural areas and 1.07 lakh-urban areas). This is a small sample size for a large and diverse country like India.
Temporal and regional variations :
- Another major challenge is to accurately incorporate seasonal variations and regional disparities in household expenditure to obtain accurate survey results.
Risks of pent-up demands :
- This survey report has been conducted after two long years of Covid in the year 2020 and the year 2021. The year 2022, in which the survey was conducted, has been a year of pent-up demand, like the last two Covid years. Therefore, the accuracy of the data can be confirmed by upcoming surveys.
Conclusion / Solution :
Using data to improve social programs :
- Using All India Consumption Expenditure Survey data run by the government To measure the impact of various social security schemes like PM Garib Kalyan Anna Yojana,
Finalization of the survey for the year 2023 – 24 :
- To finalize the survey for the year 2022-23 and the survey results for 2023-24 should be finalized as soon as possible to confirm the robustness of the methodology.
Regularization of survey :
- The new survey methodology should be institutionalized as soon as possible to establish a common five-year survey cycle (recurring every five years).
Changes in the bases of inflation indices should be awaited :
- This survey report was conducted in a year of pent-up demand, hence any change in the weightage of various parameters in the inflation indices based on the survey results would offer important ground.
- An accurate, transparent and comprehensive consumption expenditure survey data will help shape a more inclusive and equitable society.
Qualified Preliminary and Main Examination ( Written ) and Shortlisted for Personality Test (INTERVIEW) three times Of UPSC CIVIL SERVICES EXAMINATION in the year of 2017, 2018 and 2020. Shortlisted for Personality Test (INTERVIEW) of 64th and 67th BPSC CIVIL SERVICES EXAMINATION.
M. A M. Phil and Ph. D From (SLL & CS) JAWAHARLAL NEHRU UNIVERSITY, NEW DELHI.
No Comments